Psychological Networks Amsterdam Summer School – The online edition
From June 29 to July 3, we will host an online edition of the Psychological Networks Amsterdam Summer School! During this week, we will make a video lecture series available together with exercises and solutions, and will be available for assistance throughout the week on a Slack board while you work through the materials and/or work on your own data. The video lectures will also be made publicly available afterwards. Registration is now opened and can be done via this link! See the Psychosystems website for more information.

Bootnet version 1.4
The bootnet package has been updated to version 1.4 on CRAN. While not a large update, it will mark an important change in results using default settings.
Many of the default sets commonly used (e.g., pcor, EBICglasso, ggmModSelect) now no longer use cor_auto as first step in data analysis but rather cor. This means that by default, Pearson correlations will be used instead of polychoric correlations. This change has been made because using polychoric correlations as input to likelihood based estimation routines has now routinely been demonstrated to lead to less than desirable stability, especially at lower sample sizes.
The argument corMethod in estimateNetwork can be used to change the default correlation setting. Set corMethod = "cor_auto" to mimic old behavior, and set corMethod = "spearman" to use Spearman correlations instead (recommended for ordered categorical data). There is also a new argument transformation that can be used in many default sets. Set transformation = "rank" to rank-transform the data (equivalent to Spearman correlations) and set transformation = "quantile" to quantile transform the data (similar to the non-paranormal transformation).
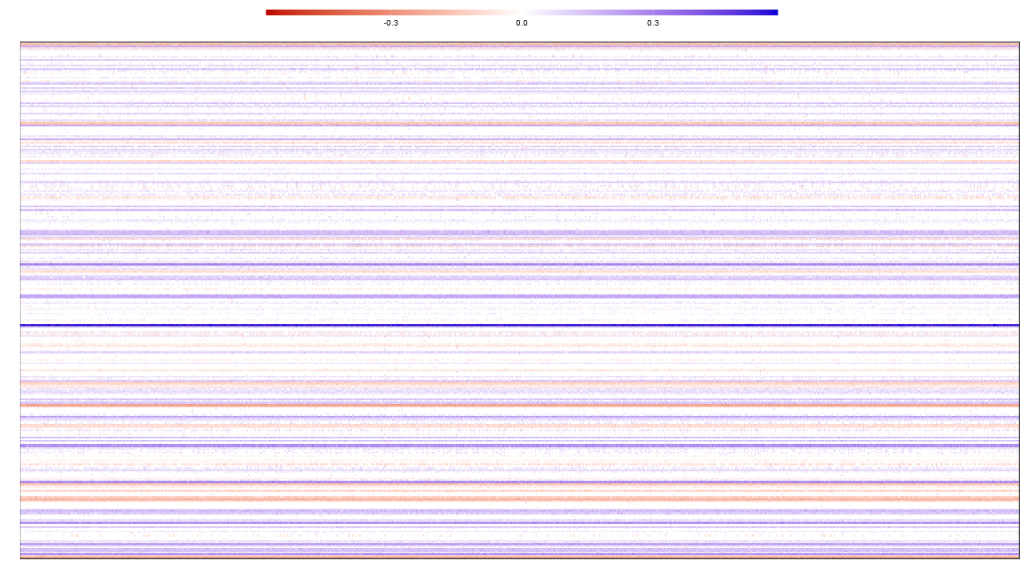
A final new feature of bootnet 1.4 is the so-called multiverse plot. This plot can be used from bootstrap results:
library("bootnet")
library("psychTools")
data(bfi)
bfiSub <- bfi[,1:25]

# Estimate network:
Network <- estimateNetwork(bfiSub,
                           default = "ggmModSelect",
                           stepwise = FALSE)

# Bootstrap:
Boots <- bootnet(Network, nCores = 32)

# Multiverse plot:
multiverse(Boots)
This will give a plot to assess stability across bootstrap replications. The plot should show horizontal lines of the same color to indicate estimation stability.
The next version of bootnet will focus on introducing new default sets for recently introduced estimation methods. If you encounter any problems with the software or if you have any suggestions for improvement, please report these on Github.