Written by Sacha Epskamp
It has been a while since I updated the R packages of the Psychosystems / psychonetrics ecosystem. The past week, however, I have submitted updates of qgraph, bootnet, graphicalVAR, mlVAR, and psychonetrics to CRAN! In this blog post I will discuss some of the most important changes; a list of all changes can be found on the NEWS page on the respective CRAN website of each of the packages. Finally, this post introduces our upcoming textbook and our free online video course.

qgraph version 1.9
Even though there is a large increase in the version number (the last version on CRAN was 1.6.9), the qgraph package is already very stable, and does not change much anymore. Version 1.9 should give less warnings for deprecated dplyr functions and includes a few bugfixes, most notably to manual color assignment of edges and some updates to the flow function. More significant changes have been made to the centrality function, which are detailed further below.
Centrality plot no longer uses z-scores by default
Following up on recommendations made in the past years, the centralityPlot function no longer uses z-scores by default. Instead, the scale argument now defaults to "raw0", which will display centrality values using their raw values and which includes 0 in the x-axis as well. This change will avoid confusion and will make it much easier to see when centrality indices are similar across nodes.
Predictability is now included for Gaussian graphical models
Th`e `centrality function now includes predictability for Gaussian graphical models, which is termed R2 in the package, as predictability in Gaussian graphical models is equivalent to the contribution to the explained variance. Predictability can be requested as follows:
centrality(..., R2 = TRUE)graphicalVAR version 0.3 and mlVAR version 0.5
The graphicalVAR and mlVAR packages mostly went through some polishing, with the exception of an important change to the beepvar argument discussed below. The graphicalVAR package will now allow for regularizing only parts of the model, and the mlVAR package now includes an experimental function mlVARsample, which is similar to netSimulator in bootnet but generates data under a fitted mlVAR object. Eren Asena has been added as contributor to the graphicalVAR package and Myrthe Veenman to the mlVAR package. Thanks for your work both!
beepvar argument changes
We discovered a bug with the beepvar argument used in graphicalVAR, mlVAR and psychonetrics. For some time, this argument (which is intended to avoid modeling non-consecutive beeps) was not working. The argument is fixed now and should be working as expected. This might lead to some different results, although most datasets I saw that used this argument did not need it (as all beeps were included). Results from the previous versions can be reproduced by omitting the beepvar argument. In addition, the packages now include a warning when there seem to be issues with the encoding of beeps in the dataset (e.g., duplicated beeps).
bootnet version 1.5
The bootnet package only went through minor changes. Most importantly, support has been added for the GGMncv package and the default gamma parameter for the mgm default set has been changed to 0.25.
psychonetrics version 0.10
Skipping version 0.9, which was only released on Github, the new version of psychonetrics includes several under the hood changes. The underlying optimizer should now be more stable and return less warnings and errors. In addition, the optimizer now uses a default tolerance that is comparable to lavaan, making results more accurate (but also a bit slower). The package also contains the fleshed-out meta-analysis functions discussed in our recent Psychometrika paper.
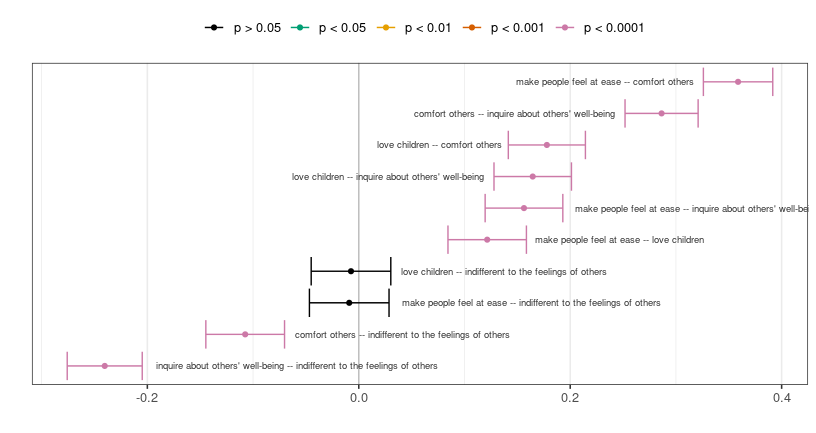
Added CIplot function
One major addition to psychonetrics is the CIplot function, which makes plotting of analytic confidence intervals simple (e.g., as shown in our recent meta-analysis paper). The function can be used for any model in psychonetrics and for any matrix estimated by psychonetrics. One important thing to note, however, is that such confidence intervals are only valid if no model selection routine was used (e.g., prune, stepup or modelsearch). A psychonetrics object remembers however if such a routine was used, and as a result CIplot will return a warning when used on a model on which modelsearch algorithms were used as well.
Network Psychometrics Textbook
We have also completed writing a textbook this year, which will be available next year. The book can already be pre-ordered, and will contain a lot of updated information on network psychometrics for applied researchers, with an emphasis on the use of the R packages discussed in this post.
Free video course
Finally, due to finishing the book we did not host a summer school on network analysis this year. However, we have made our entire video course from the last winter school available online for free. Currently, you can register to watch these videos until the end of 2021 (once registered, you will have access indefinitely).
Recent Comments